Ditch the Web Dashboard: Debugging Webhooks Entirely in the Terminal
Quick answer
Ditch the Web Dashboard: Debugging Webhooks Entirely : quick comparison answer
Choose the tunnel tool based on the network model: public HTTPS URLs for webhooks and demos, private mesh access for internal apps, and managed infrastructure when policy controls matter most.
Which tunnel tool is best for public webhook testing?
Use a public HTTPS localhost tunnel with stable URLs. InstaTunnel focuses on webhook testing, demos, OAuth callbacks, and MCP endpoint workflows.
When should I choose a private network tool instead?
Choose a private mesh or Zero Trust tool when every user and service should stay inside a controlled private network.
Every backend developer knows the cognitive friction of context switching. You’re deep in flow state inside your terminal — juggling tmux panes, navigating files in Neovim, tailing logs with tail -f — when a third-party webhook from Stripe, GitHub, or Twilio needs testing.
What happens next is a subtle productivity killer:
- You switch windows to a browser.
- You open a tab to
localhost:4040or a SaaS dashboard. - You click through a list of HTTP requests with a mouse.
- You copy the payload, switch back to your editor, format the JSON, and hand-craft a
curlcommand to replay it.
For terminal-obsessed developers, that Alt-Tab dance breaks focus and fragments workflow state.
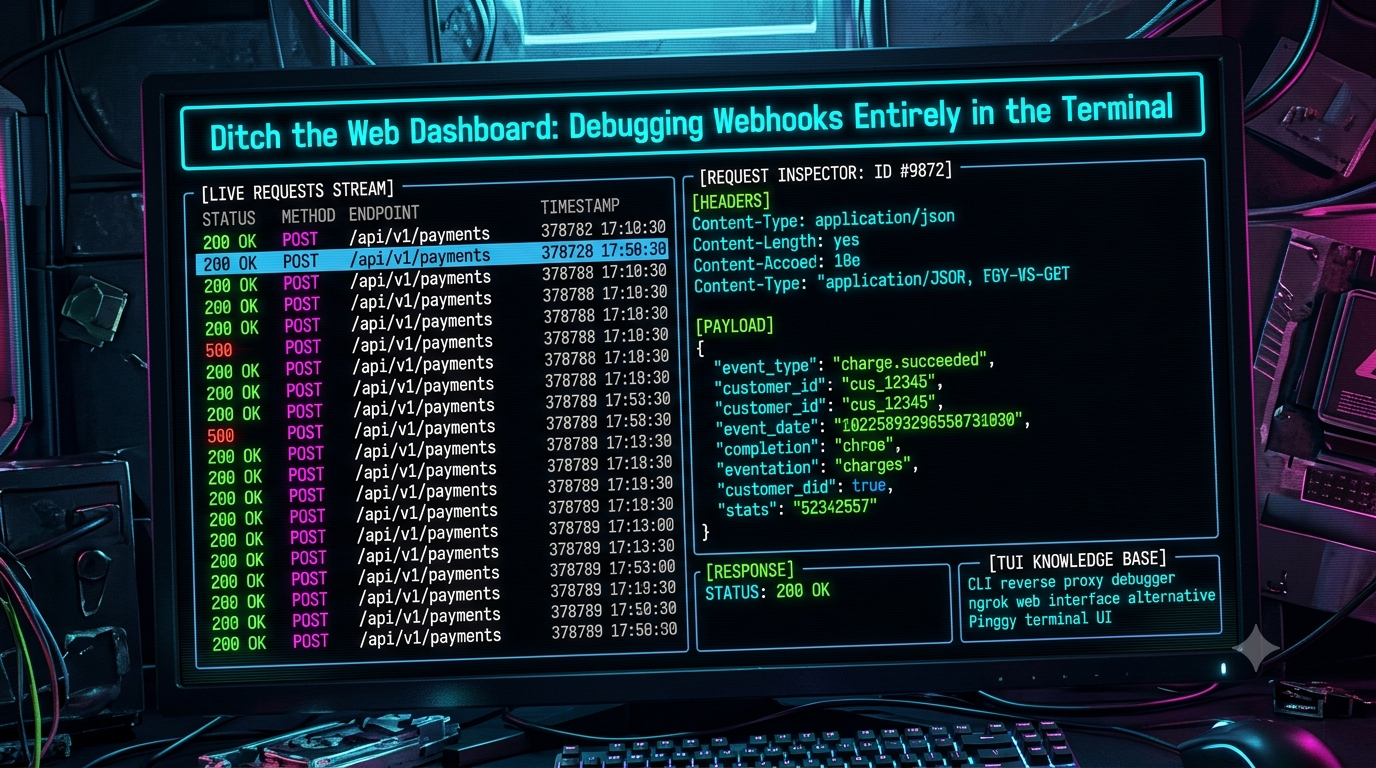
A real shift has been happening in backend tooling, though: a new generation of CLI reverse-proxy tunnels ships with Terminal UI (TUI) request logging, and some go further with payload inspection and one-key replay, right inside the terminal. This piece looks at why that matters, evaluates the leading zero/low-install tunnel tools — Pinggy, LocalXpose, and ngrok — and walks through building a terminal-first webhook debugging setup, including a custom TUI inspector in Go.
The Real Cost of Context Switching
It’s tempting to treat the Alt-Tab dance as a minor annoyance, but the research on interruption cost is fairly consistent: UC Irvine researcher Gloria Mark’s widely cited work found it takes people roughly 23 minutes to fully return to a task after an interruption. Estimates specific to programming work vary — some put the recovery cost for developers at 15 to 30 minutes per switch, since reconstructing a mental model of variable state, call stack, and architecture is more expensive than resuming a simpler task. Either way, the number is bigger than the few seconds an Alt-Tab appears to cost.
That’s the underlying case for keeping webhook inspection in the same terminal session as your editor and logs, rather than a browser tab you have to context-switch into.
+-----------------------------------------------------------------------------------+
|  TRADITIONAL WORKFLOW (High Friction)                                             |
|  [Neovim / CLI] ---> Alt-Tab ---> [Browser Dashboard] ---> Copy JSON ---> CLI      |
+-----------------------------------------------------------------------------------+
|  TERMINAL-FIRST WORKFLOW (Low Friction)                                           |
|  [tmux Pane 1: Editor]  |  [tmux Pane 2: App Logs]  |  [tmux Pane 3: Tunnel/TUI]   |
+-----------------------------------------------------------------------------------+
What to Look For in a Terminal-Native Webhook Workflow
Not all CLI tunnel tools offer the same depth of terminal-native inspection. A few things separate a genuinely useful setup from raw stdout scrolling past too fast to read:
- Real request visibility without leaving the terminal. At minimum, a live list of method/path/status. Ideally, headers and body too — some tools only give you the former in-terminal and push the latter to a browser.
- Readable JSON. Syntax highlighting and folding for large payloads, or an easy pipe to a terminal JSON viewer.
- Request replay. Re-sending the exact captured request without hand-building a
curlcommand. - Reasonable installation friction. Some tools run over plain
sshwith nothing to install; others need a binary or an npm package. Neither is wrong, but it’s worth knowing which trade-off you’re making.
Tool Comparison
| Tool | In-terminal request list | Header/body inspection | Replay | Install |
|---|---|---|---|---|
| Pinggy | Yes (TUI, over SSH) | Via browser Web Debugger by default; full in-terminal TUI requires the optional Node CLI | Yes (Web Debugger: Replay and Modify-and-Replay) | None (SSH) or npm install -g pinggy for the richer TUI |
| LocalXpose | Yes (TUI is the default mode) | Yes, in both the TUI and the web dashboard | Yes | Binary (loclx) or Docker |
| Hooklistener | Yes (dedicated TUI command) | Yes | Forwarding rather than inspector-style replay | Binary, Rust-buildable |
| ngrok | Minimal (method/path/status only) | No — full headers/body/replay live in the browser at 127.0.0.1:4040 |
Yes, but only from the web inspector | CLI binary + account |
1. Pinggy: Zero-Install SSH Tunneling — With a Caveat on What the TUI Actually Shows
Pinggy’s headline feature is that it needs no client installation: a single ssh command opens a reverse tunnel and, in the same terminal session, a live TUI showing your public URL, connection stats, and — if you use the qr or aqr keyword — a QR code rendered in ASCII for instant mobile testing.
ssh -p 443 -R0:localhost:8000 qr@a.pinggy.io
Where the original pitch of “everything in one SSH command” needs a correction: that bare TUI shows connection status and traffic stats, not full request headers and JSON bodies. For actual header/payload inspection and one-click replay, Pinggy ships a separate Web Debugger — a browser-based tool you reach by forwarding a local port alongside the tunnel:
ssh -p 443 -R0:localhost:8888 -L4300:localhost:4300 \
  -o StrictHostKeyChecking=no -o ServerAliveInterval=30 a.pinggy.io
With the web debugger toggle on, opening localhost:4300 in a browser gives you the full request/response view — headers, status codes, cookies — plus the ability to modify and replay requests. So the “zero-browser” claim is only true for watching connection stats and grabbing your tunnel URL; deep payload inspection is still a browser tool, just a local one rather than a SaaS dashboard.
If a genuinely in-terminal request/response browser matters more to you than zero installation, Pinggy also publishes an official Node.js CLI (npm install -g pinggy) with a real “built-in TUI for viewing tunnel statistics, requests, and responses in real time,” plus a persistent background daemon, saved tunnel configs, and commands like pinggy ps, pinggy attach, and pinggy logs. That trades the zero-install property for a proper terminal request viewer — worth knowing which one you’re actually reaching for.
Other current Pinggy facts worth noting: the free tier is capped at 60-minute sessions with no signup required; paid tunnels start around $2.50–3/month depending on billing; and Pinggy supports HTTP, HTTPS, TCP, and UDP tunnels — UDP being something ngrok still doesn’t offer as of 2026.
2. LocalXpose: TUI by Default, With Header/Payload Inspection Built In
LocalXpose’s CLI (loclx) actually matches the original pitch more closely than Pinggy’s zero-install path does — its terminal UI is the default rendering mode, not an opt-in. The --raw-mode / -r flag exists specifically to disable the TUI for background processes or legacy systems.
loclx tunnel http --to 3000 --region us
(Note the corrected flag: it’s --region, not --reserved-region — that’s used for domain reservation subcommands, not the main tunnel command.) LocalXpose’s own product documentation states it lets you inspect headers, payloads, and response times, and replay webhooks, through either the CLI or a web dashboard — so unlike Pinggy’s default path, header/body inspection isn’t pushed exclusively to a browser.
LocalXpose also supports UDP tunneling alongside HTTP, HTTPS, TCP, and TLS — useful if your webhook-adjacent work touches gaming servers, VoIP, or IoT firmware, none of which ngrok currently handles.
3. ngrok: The Standard, and Why Its CLI Alone Isn’t Enough
ngrok remains the most recognized name in this space, and its terminal output is intentionally minimal:
ngrok by @inconshreveable                                     (Ctrl+C to quit)

Session Status                online
Account                       you (Plan: Free)
Version                       3.x.x
Region                        United States (us)
Web Interface                 http://127.0.0.1:4040
Forwarding                    https://a1b2c3.ngrok-free.app -> http://localhost:8000

HTTP Requests
-------------
GET  /webhooks/github          200 OK
POST /webhooks/stripe          500 Internal Server Error
That status screen shows method, path, and status code — nothing more. To see headers, the raw request/response body, or to replay a request, you have to open http://127.0.0.1:4040 in a browser. ngrok’s own documentation confirms the web inspection interface is where you see full request/response detail including headers, query parameters, payload, and response body, and it’s also where request filtering (by path, status code, response size, duration, or header value) and replay both live. There’s no CLI-only path around this — it’s a deliberate design choice, not a missing feature.
ngrok’s current plan names, for anyone budgeting: Free, Hobbyist, Pay-as-you-go, and Enterprise (an older “Pro”/“Personal” naming shows up in some third-party write-ups but doesn’t match ngrok’s current pricing page). And as of 2026, ngrok still has no UDP tunnel support — an architectural gap, not a configuration option, according to third-party comparisons of the current tunneling landscape.
4. Hooklistener: A Newer Rust-Built Option With a Genuine TUI
Worth a mention for anyone specifically shopping for webhook tooling with a real in-terminal browser: Hooklistener’s CLI combines tunnel creation with a dedicated command that launches an interactive TUI to browse and debug captured webhook requests, plus a forwarding mode to replay traffic against your local server. It’s a newer, smaller player next to ngrok and Pinggy, but it’s a genuine example of the “everything in the terminal” pattern the rest of this piece argues for, and it’s built in Rust with binaries available directly from GitHub releases.
Building a Terminal-First Debugging Environment with tmux & Neovim
A small tmux layout keeps your editor, app logs, and tunnel/inspector visible at once:
+------------------------------------------------------------------------------------+
| TMUX SESSION: "webhook-dev"                                                        |
+----------------------------------------------------+-------------------------------+
| PANE 1: Neovim (App Code)                           | PANE 3: Pinggy TUI            |
|                                                       | (connection stats, QR code,  |
| 1  const express = require('express');               | tunnel URL — open the Web     |
| 2  const app = express();                            | Debugger at localhost:4300    |
| 3  app.post('/stripe-webhook', (req, res) => {       | in a browser for full         |
| 4    const event = req.body;                         | header/payload inspection)   |
| 5    console.log(event.type);                        |                               |
| 6    res.json({ received: true });                   |                               |
| 7  });                                               |                               |
+----------------------------------------------------+-------------------------------+
| PANE 2: Application Stdout                          | PANE 4: cURL / Shell Runner   |
| [INFO] Server listening on port 8000                | $ curl -X POST localhost:8000 |
| [LOG] Received event: charge.failed                  |                               |
+----------------------------------------------------+-------------------------------+
Automation script:
#!/usr/bin/env bash

SESSION="webhook-debugging"

# 1. Start a new tmux session in detached mode
tmux new-session -d -s $SESSION -n "Main"

# 2. Split the window vertically (editor left, tunnel/debugger right)
tmux split-window -h -p 45

# 3. Split the left pane horizontally (editor top, app server bottom)
tmux select-pane -t 0
tmux split-window -v -p 30

# 4. Run your application in Pane 1 (bottom left)
tmux send-keys -t 1 "npm run dev" C-m

# 5. Launch Neovim in Pane 0 (top left)
tmux send-keys -t 0 "nvim src/server.js" C-m

# 6. Launch a Pinggy tunnel with the web debugger port forwarded (Pane 2, right)
tmux select-pane -t 2
tmux send-keys -t 2 "ssh -p 443 -R0:localhost:8000 -L4300:localhost:4300 qr@a.pinggy.io" C-m

# 7. Attach to the tmux session
tmux attach-session -t $SESSION
With this script run once, your editor, app logs, and tunnel all boot together in a single terminal window — and if you want to check a payload, localhost:4300 is one browser tab away rather than a search through a SaaS dashboard.
Crafting a Custom TUI Webhook Inspector in Go (Bubble Tea)
If none of the existing tools fit exactly, Go’s Bubble Tea framework (part of Charm’s toolset, based on the Elm Architecture) makes it straightforward to write a small local proxy that logs incoming requests into a scrollable terminal view. Bubble Tea has real production usage behind it — Charm’s own Crush coding agent, along with tools like Glow and Huh, are built on it, and it reached a major v2 release with a reworked rendering architecture in 2026 (worth checking if you’re starting a new project, since some APIs shifted from the v1 patterns below).
package main

import (
	"fmt"
	"net/http"

	tea "github.com/charmbracelet/bubbletea"
	"github.com/charmbracelet/lipgloss"
)

// RequestMsg transports intercepted HTTP requests to the TUI state
type RequestMsg struct {
	Method  string
	Path    string
	Headers map[string]string
	Body    string
}

// model holds our TUI state
type model struct {
	requests []RequestMsg
	cursor   int
}

func initialModel() model {
	return model{requests: make([]RequestMsg, 0)}
}

func (m model) Init() tea.Cmd { return nil }

func (m model) Update(msg tea.Msg) (tea.Model, tea.Cmd) {
	switch msg := msg.(type) {
	case tea.KeyMsg:
		switch msg.String() {
		case "ctrl+c", "q":
			return m, tea.Quit
		case "up", "k":
			if m.cursor > 0 {
				m.cursor--
			}
		case "down", "j":
			if m.cursor < len(m.requests)-1 {
				m.cursor++
			}
		}
	case RequestMsg:
		m.requests = append(m.requests, msg)
	}
	return m, nil
}

func (m model) View() string {
	title := lipgloss.NewStyle().Bold(true).
		Foreground(lipgloss.Color("#FAFAFA")).
		Background(lipgloss.Color("#7D56F4")).
		Padding(0, 1)

	s := title.Render("Terminal Webhook Inspector") + "\n\n"

	if len(m.requests) == 0 {
		return s + "Waiting for incoming webhooks..."
	}

	for i, req := range m.requests {
		cursor := " "
		if m.cursor == i {
			cursor = ">"
		}
		s += fmt.Sprintf("%s [%s] %s\n", cursor, req.Method, req.Path)
	}

	s += fmt.Sprintf("\n--- Payload ---\nBody: %s\n", m.requests[m.cursor].Body)
	s += "\nPress 'q' to quit. Use 'j/k' to scroll."
	return s
}

func main() {
	p := tea.NewProgram(initialModel())

	go func() {
		http.HandleFunc("/", func(w http.ResponseWriter, r *http.Request) {
			p.Send(RequestMsg{
				Method: r.Method,
				Path:   r.URL.Path,
				Body:   `{"status": "mock_webhook_received"}`,
			})
			w.WriteHeader(http.StatusOK)
		})
		http.ListenAndServe(":9090", nil)
	}()

	if _, err := p.Run(); err != nil {
		fmt.Printf("Error running TUI: %v", err)
	}
}
If Go isn’t your stack, Rust’s Ratatui is the equivalent ecosystem standard — it powers tools like gitui, yazi, and bottom, and gives you more direct control over the render loop at the cost of more boilerplate than Bubble Tea’s Elm-style model.
Web Dashboard vs. Terminal Inspection
| Dimension | Traditional web dashboard (ngrok web, most SaaS) | Terminal-native tooling (LocalXpose TUI, Hooklistener, custom Bubble Tea/Ratatui) |
|---|---|---|
| Memory footprint | Heavier — a browser tab plus rendering engine | Lighter — a single terminal process |
| Keybindings | Browser-dependent, limited | Fully customizable, vim-style navigation common |
| Session persistence | Tied to the browser tab/session | Native to stdout, pipeable to a log file |
| Remote compatibility | Needs local port forwarding + a browser | Works headlessly over SSH |
| Scriptability | Low | High — pipes cleanly into jq, fx, grep, fzf |
Practical Habits for Terminal-First Debugging
Learn a terminal JSON viewer. fx (a real, actively maintained Go tool) is a solid option for exploring JSON, YAML, or TOML interactively in the terminal, with JavaScript-based filtering and vim-style navigation:
curl -s http://localhost:4040/api/requests/http | fx
Know which tool actually replays in-terminal. LocalXpose and Hooklistener let you stay in the terminal for replay; ngrok and Pinggy’s default path push replay to a browser (Pinggy’s Web Debugger, ngrok’s inspector at 127.0.0.1:4040).
Use an SSH config alias for repeat sessions, since typing the full command with a port forward gets old fast:
Host pinggy-debug
    HostName a.pinggy.io
    User qr
    Port 443
    RemoteForward 0 localhost:8000
    LocalForward 4300 localhost:4300
    RequestTTY yes
Then a single ssh pinggy-debug starts the tunnel with the web debugger port already forwarded.
Sanitize sensitive payloads before they hit stdout or a shared tmux log. Webhooks from payment providers routinely carry signatures, tokens, or partial PII — worth stripping before printing full request bodies anywhere they might be logged or shared.
Conclusion
The honest picture, after checking these tools against their own documentation, is more nuanced than “terminal good, browser bad.” LocalXpose genuinely delivers full in-terminal inspection by default. Pinggy’s zero-install path gets you a tunnel and connection stats over bare SSH, but real payload inspection still happens in a browser unless you opt into its separate Node CLI. ngrok is upfront that its terminal output is a status screen, not an inspector, by design. None of that erases the underlying case for keeping as much of the workflow as possible in the terminal — it just means picking the tool that actually matches what “terminal-native” means to you, rather than assuming every tunnel with a fancy startup screen gives you the same thing.
Quick Implementation Checklist
- [ ] Pick a tunnel based on what you actually need in-terminal: LocalXpose or Hooklistener for full request/header/body inspection without a browser; Pinggy for the lightest zero-install footprint (with the Web Debugger a click away); ngrok if you’re already invested in its ecosystem and don’t mind the browser step.
- [ ] Add an SSH alias or CLI shortcut to your shell config.
- [ ] Set up a tmux or zellij layout that keeps editor, app logs, and tunnel visible together.
- [ ] Learn the replay and filtering mechanism for whichever tool you pick — they’re not identical across tools.
- [ ] Sanitize sensitive payload data before it hits any shared log.
Changelog
Fact-checked against each vendor’s current documentation and reworked from the original draft. Key changes:
- Corrected the context-switching statistic. The original “15 to 20 minutes to regain focus” was replaced with the more precisely sourced figure from Gloria Mark’s UC Irvine research (~23 minutes), with a note on the wider 15–30 minute range cited specifically for developer/programming interruptions.
- Corrected the central claim about Pinggy’s zero-install TUI. The original draft showed a single bare
sshcommand producing a full split-pane header/payload inspector with one-key replay. In fact, Pinggy’s zero-install SSH path opens a TUI with connection stats, tunnel URL, and an optional QR code — full header/payload inspection and replay require either (a) the browser-based Web Debugger, reached via a local port forward (-L4300:localhost:4300), or (b) Pinggy’s separate official Node.js CLI (npm install -g pinggy), which does provide a genuine in-terminal request/response TUI but is no longer a zero-install tool. Both the tmux script and the SSH-alias example were updated to include the debugger port forward. - Corrected the LocalXpose CLI flag.
--reserved-region(used in the original draft) isn’t a real flag; the correct flag is--region.--reserved-domainis a separate, related flag for domain reservation. - Added that LocalXpose’s TUI is on by default, per its own CLI docs (
--raw-mode/-ris what disables it), and that it explicitly supports in-CLI header/payload/replay, not just via its web dashboard. - Removed “webhook-tui” from the tool comparison — no evidence this is a real, named product. Replaced it with Hooklistener, a real Rust-built CLI with a genuine dedicated TUI command for browsing and debugging webhook requests.
- Added current facts: ngrok’s lack of UDP tunnel support as of 2026; Pinggy’s 60-minute free-tier session cap and UDP support; ngrok’s current plan names (Free, Hobbyist, Pay-as-you-go, Enterprise); Bubble Tea’s v2 architecture overhaul and real production usage (Crush, Glow, Huh); Ratatui as the Rust-ecosystem equivalent;
fxas a verified, real terminal JSON viewer. - Left largely intact: the description of ngrok’s CLI as a minimal status screen requiring the browser inspector at
127.0.0.1:4040for headers/body/replay — this matches ngrok’s own documentation.
Primary sources checked: ngrok’s Agent Web Inspection Interface docs, Pinggy’s official CLI docs and cli-js GitHub repository, LocalXpose’s CLI documentation and product pages, Hooklistener’s CLI guide, the Bubble Tea/Ratatui GitHub repositories, fx’s official documentation, and Gloria Mark’s context-switching research as cited across multiple secondary sources.
Related InstaTunnel pages
Continue from this article into the most relevant product guides and workflows.
Related Topics
Keep building with InstaTunnel
Read the docs for implementation details or compare plans before you ship.